Create partial predictions and partial prediction plots.
Source:R/partial-prediction-helpers.R
partial-prediction.RdPartial predictions allow you to explore and understand the impact of each of the covariates used in the conmat GAM model. See 'Details' for more information.
Usage
partial_effects(model, ages, ...)

# S3 method for class 'contact_model'
partial_effects(model, ages, ...)

# S3 method for class 'setting_contact_model'
partial_effects(model, ages, ...)

# S3 method for class 'setting_contact_model'
partial_effects_sum(model, ages, ...)
Arguments
- model
A fitted contact model, with class
contact_model(fromfit_single_contact_model(), or a simple element from list output offit_setting_contacts()), e.g.polymod_setting_models$home. Or, classsetting_contact_model- a list of fitted contact models (fromfit_setting_contacts())), e.g.polymod_setting_models.- ages
vector of integer ages.
- ...
extra arguments. Currently not used.
Value
data frame with 20 columns plus n rows based on expand.grid combination of ages. Contains transformed coefficients from ages.
Details
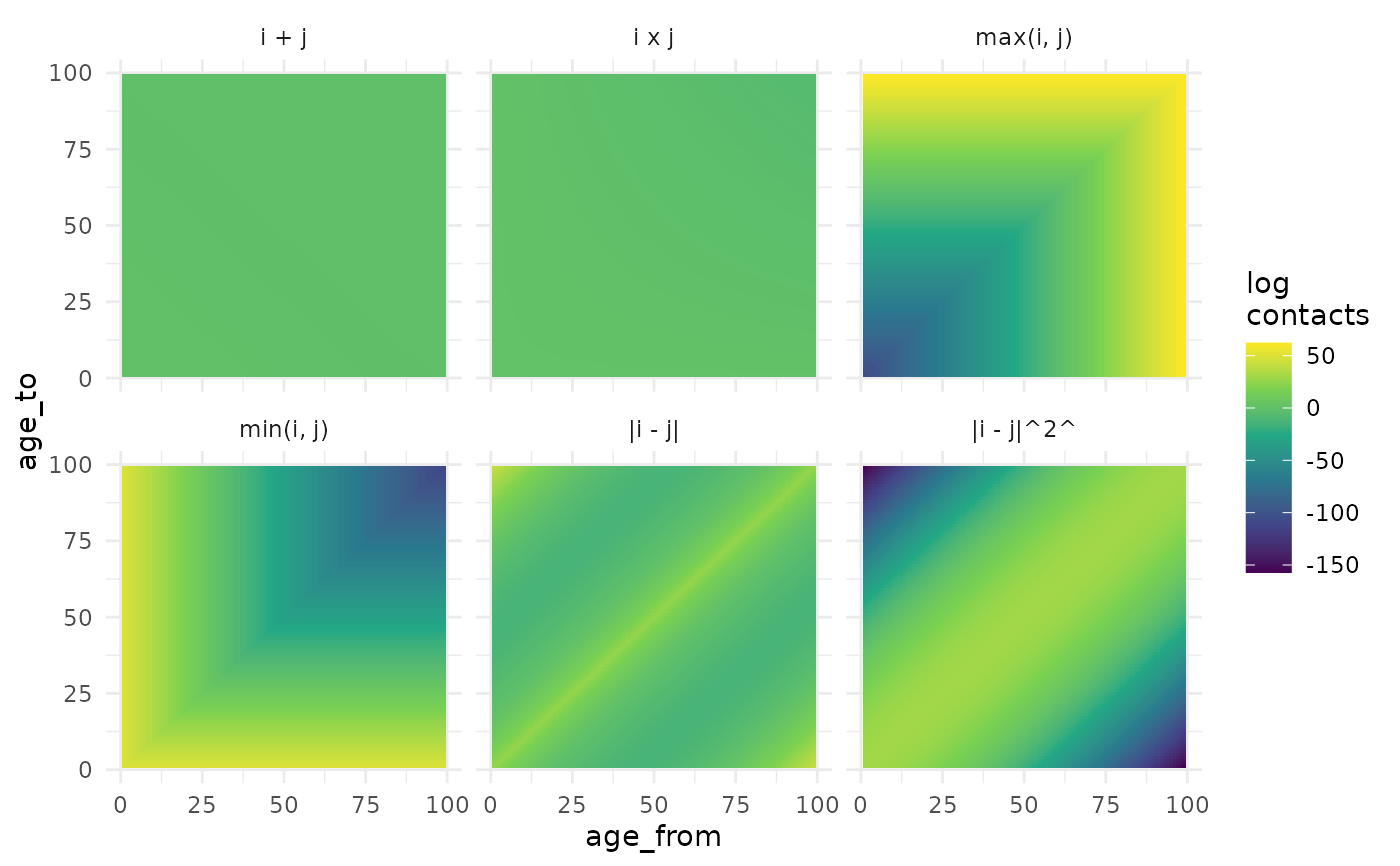
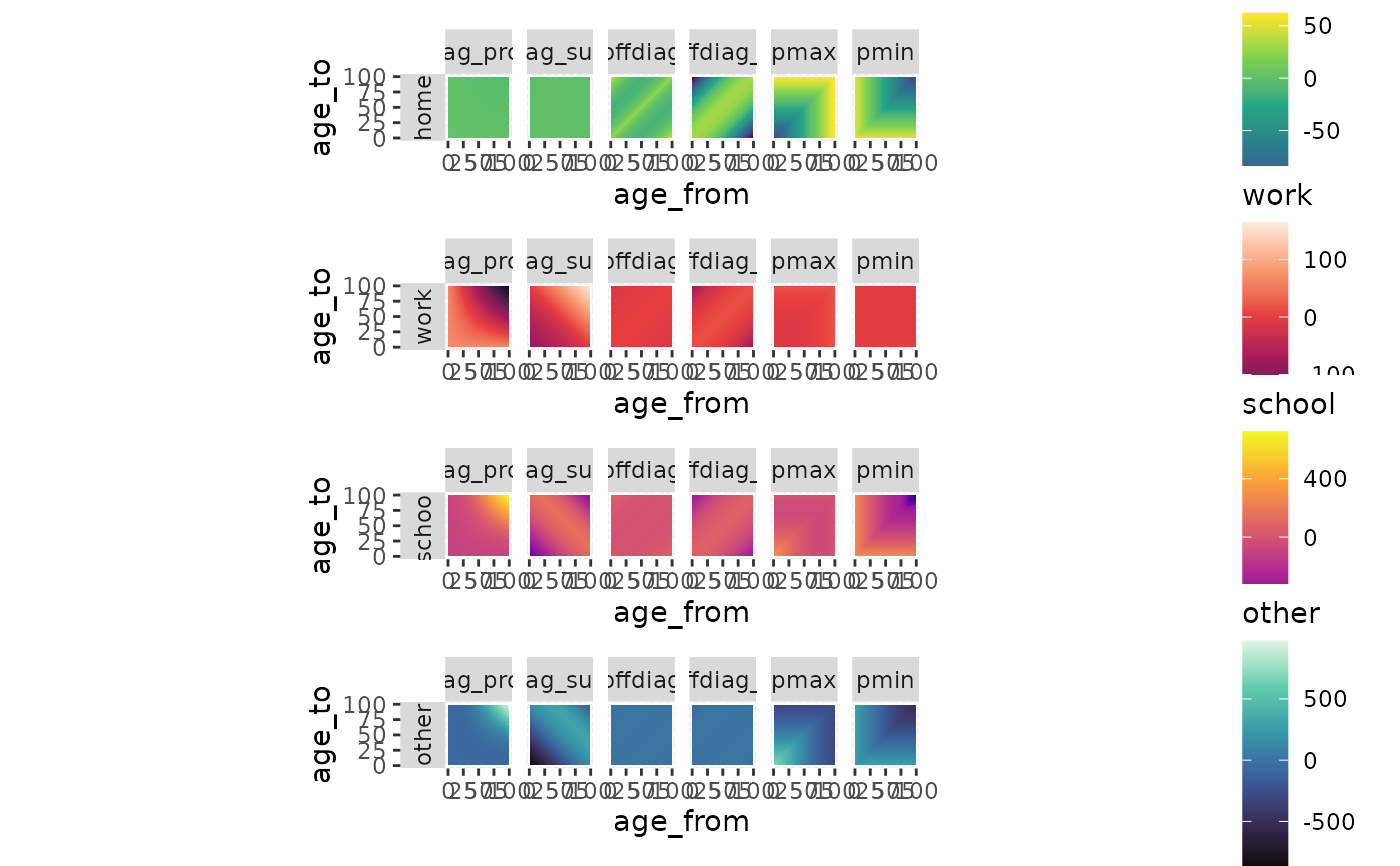
Partial predictive plots give a visual representation of the effect of each covariate on the model, or (equivalently) the effect of each setting on the total contact matrix. Positive values indicate more contacts in that region of the matrix compared to the null case, while negative values indicate less. Essentially, they represent the change in outcome variable on the model scale with a unit change in input variable.
Scales are not comparable across settings, as each setting has it's own intercept term which is not accounted for in partial effects.